

Content of review 1, reviewed on October 26, 2016
A cohort is not representative of humanity
In the freshly published research letter [1], Dong, Milholland, and Vijg (DMV) reported that they found strong evidence for a limit to human lifespan. Analyzing data from International Database on Longevity [2], they found that the yearly maximum reported age at death (MRAD, i.e. age at death of the world’s oldest person died in a specific year) stopped increasing from the mid-1990-s reaching a plateau at around 115 years. Even though the authors acknowledge that the data on “the supercentenarians <…> are still noisy and made of small samples”, they feel safe to conclude that “the results strongly suggest that the human lifespan has a natural limit”. I argue that the results and conclusions of the study are likely to be caused by just a data artifact, and that they are hardly generalizable for the humanity.
The authors chose to divide the study period at the year 1995, which is an arbitrary decision. Yet, this decision imposed a strong effect on the results and conclusions. The conclusions are based primarily on the basis of liner regression trends for the two sub-periods (figure 1, lines 1 and 2). The main conclusion is derived from the negative slope for the second sub-period (figure 1, line 1), which is largely explained by the high outliers (1997 and 1999) and low outliers in the first and the last two years (1995, 2006 and 2007). When those outliers are omitted, the slope for the second sub-period flattens greatly (regression coefficients for lines 2 and 3 are -0.36 and -0.11).
Figure 1. Reported age at death of supercentenarians

NOTE. The yearly maximum reported age at death (MRAD). The lines represent the functions of linear regressions. All data were collected from the IDL database (all 15 countries included, 1968–2007, n = 668). Unlike DMV, I use all the death records from IDL available on 9 October 2016, not just the data for France, Japan, UK, and US. Unlike DMV, I take MRAD values as age-at-death in days divided by 365.25 to convert into years, not the rounded to years values. The above mentioned data decisions of DMV are not explained and justified in the paper, and, in my view, are not optimal. The outliers are identified with Cook’s distance in two steps. Cook’s distances are 0.57 and 0.10 for the observations 1997 and 1999 in the model 2. After the removal of the high outliers, Cook’s distance for the observations 1995, 2006, and 2007 are 1.50, 0.19, and 0.46, correspondingly.
With the outliers omitted, there is only a tiny difference between the trend lines for the first sub-period and the whole period (figure 1, lines 1 and 4, regression coefficients are 0.15 and 0.12). Seeing how volatile the data are, it seems too hurriedly to drive humanity-wide conclusions based on the presented type of analysis. Imagine, we would now have these data just until 1991. The similarly arbitrary division of the study period at the year 1981 would have shown that the growth in MRAD had stopped and even reverted (figure 1, line 5). We would have then concluded that there was strong evidence for “the limit of human lifespan” at around 113.5 years. Yet, the following one and a half decade would have proven us to be misinterpreting the development of MRAD.
However, the haste of conclusions based on highly vulnerable linear regression estimates is not the only caveat of the presented paper. I believe, it is essentially incorrect to draw conclusions about such an ecumenical concept as human lifespan limit based on so sporadic and erratic data. Most likely, the slowdown in MRAD in 2000-s is a cohort effect. Namely, the difference behind the top-survivors’ data analyzed here is the increase in old-age cohort age-specific mortality rates that took place in the United States in the cohorts born in 1880-s as compared to the cohorts born in 1870-s (figure 2).
Figure 2: Cohort mortality rates in the United states
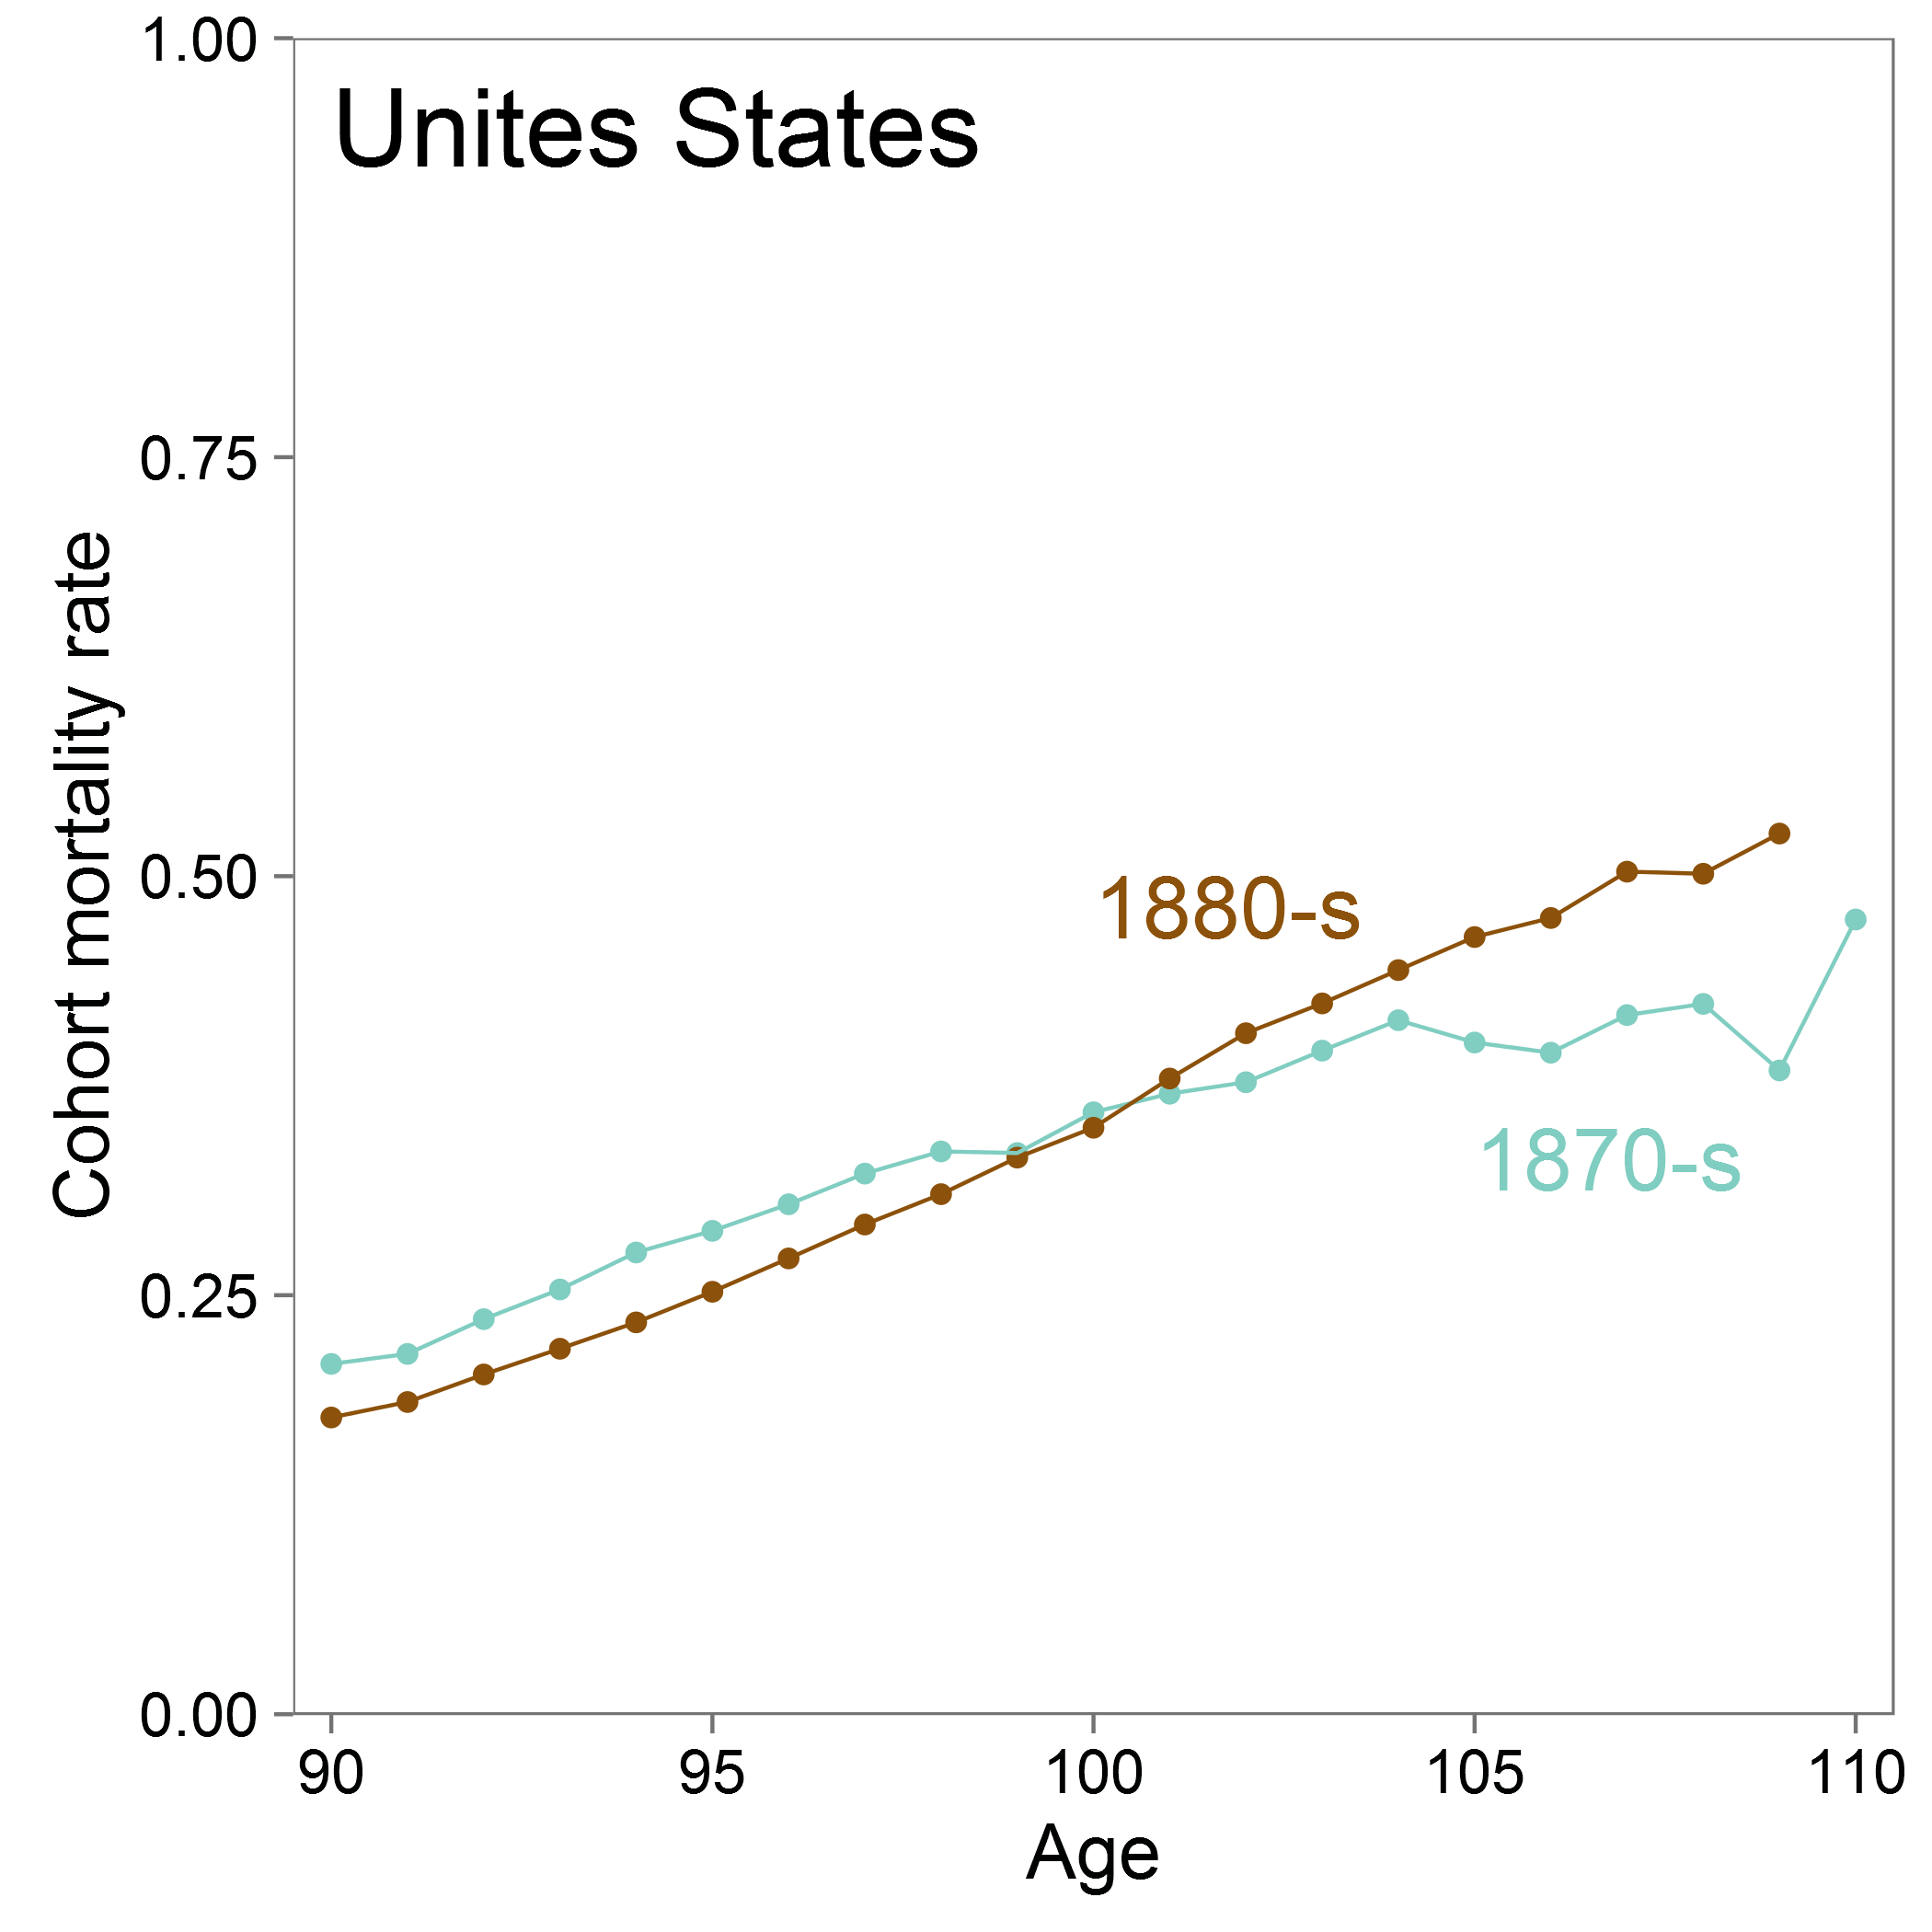
NOTE. Data are cohort age-specific mortality rates (CASMR) from Human Mortality Database [3]. The lines represent the average CASMR over two groups of birth cohorts, ten 1-year birth cohorts each: born in 1870-s and 1880-s. See the similar graphs for France, Great Britain, Japan, and Sweden in Extended Data Figure 2.
The US had exceptionally low old-age mortality in the cohorts of 1870-s. That is why the majority of MRAD supercentenarians in 1980-s and 1990-s were from the US (see extended data table 1). For some reasons (which are beyond the scope of the present letter), maximal longevity of the US 1880-s births cohorts tuned out worse than that of the 1870-s birth cohorts (with the average difference in mortality rates of 0.05 at the ages 100-110; p-value < 0.0001). Higher mortality in succeeding cohorts as compared to the preceding cohorts is a relatively rare case; as we may see from the Extended Data Figure 2, similar rise in old-age mortality did not happen in France, Great Britain, Japan, or Sweden. So, quite a local effect of the increase in the US cohort mortality was uplifted by DMV to report the presence of a natural limit for human longevity.
Summing up, the presented evidence does not clearly “suggest that the maximum lifespan of humans is fixed and subject to natural constraints”. I believe, we better put faith in the results of demographers (e.g. Vaupel [4] or Vallin & Meslé [5]), who draw much more optimistic projections based on the population-wide analyses. The dynamics of human mortality show that increased percentages of human populations reach more and more mature ages; eventually the 115-year “limit” will fall, and, in some years, we will likely speculate over the 120-year limit. And so on.
REFERENCES
- Dong, X., Milholland, B. & Vijg, J. Evidence for a limit to human lifespan. Nature (2016). doi:10.1038/nature19793
- Maier, H. et al. Supercentenarians (Springer, 2010). doi:10.1007/978-3-642-11520-2_2
- The Human Mortality Database (http://www.mortality.org, 2016).
- Vaupel, J. W. Biodemography of human ageing. Nature 464, 536–542 (2010).
- Vallin, J. & Meslé, F. The Segmented Trend Line of Highest Life Expectancies. Population and Development Review 35, 159–187 (2009).
SUPPLEMENTARY MATERIALS
Extended Data Figure 2: Cohort mortality rates in France, Great Britain, Japan, and Sweden
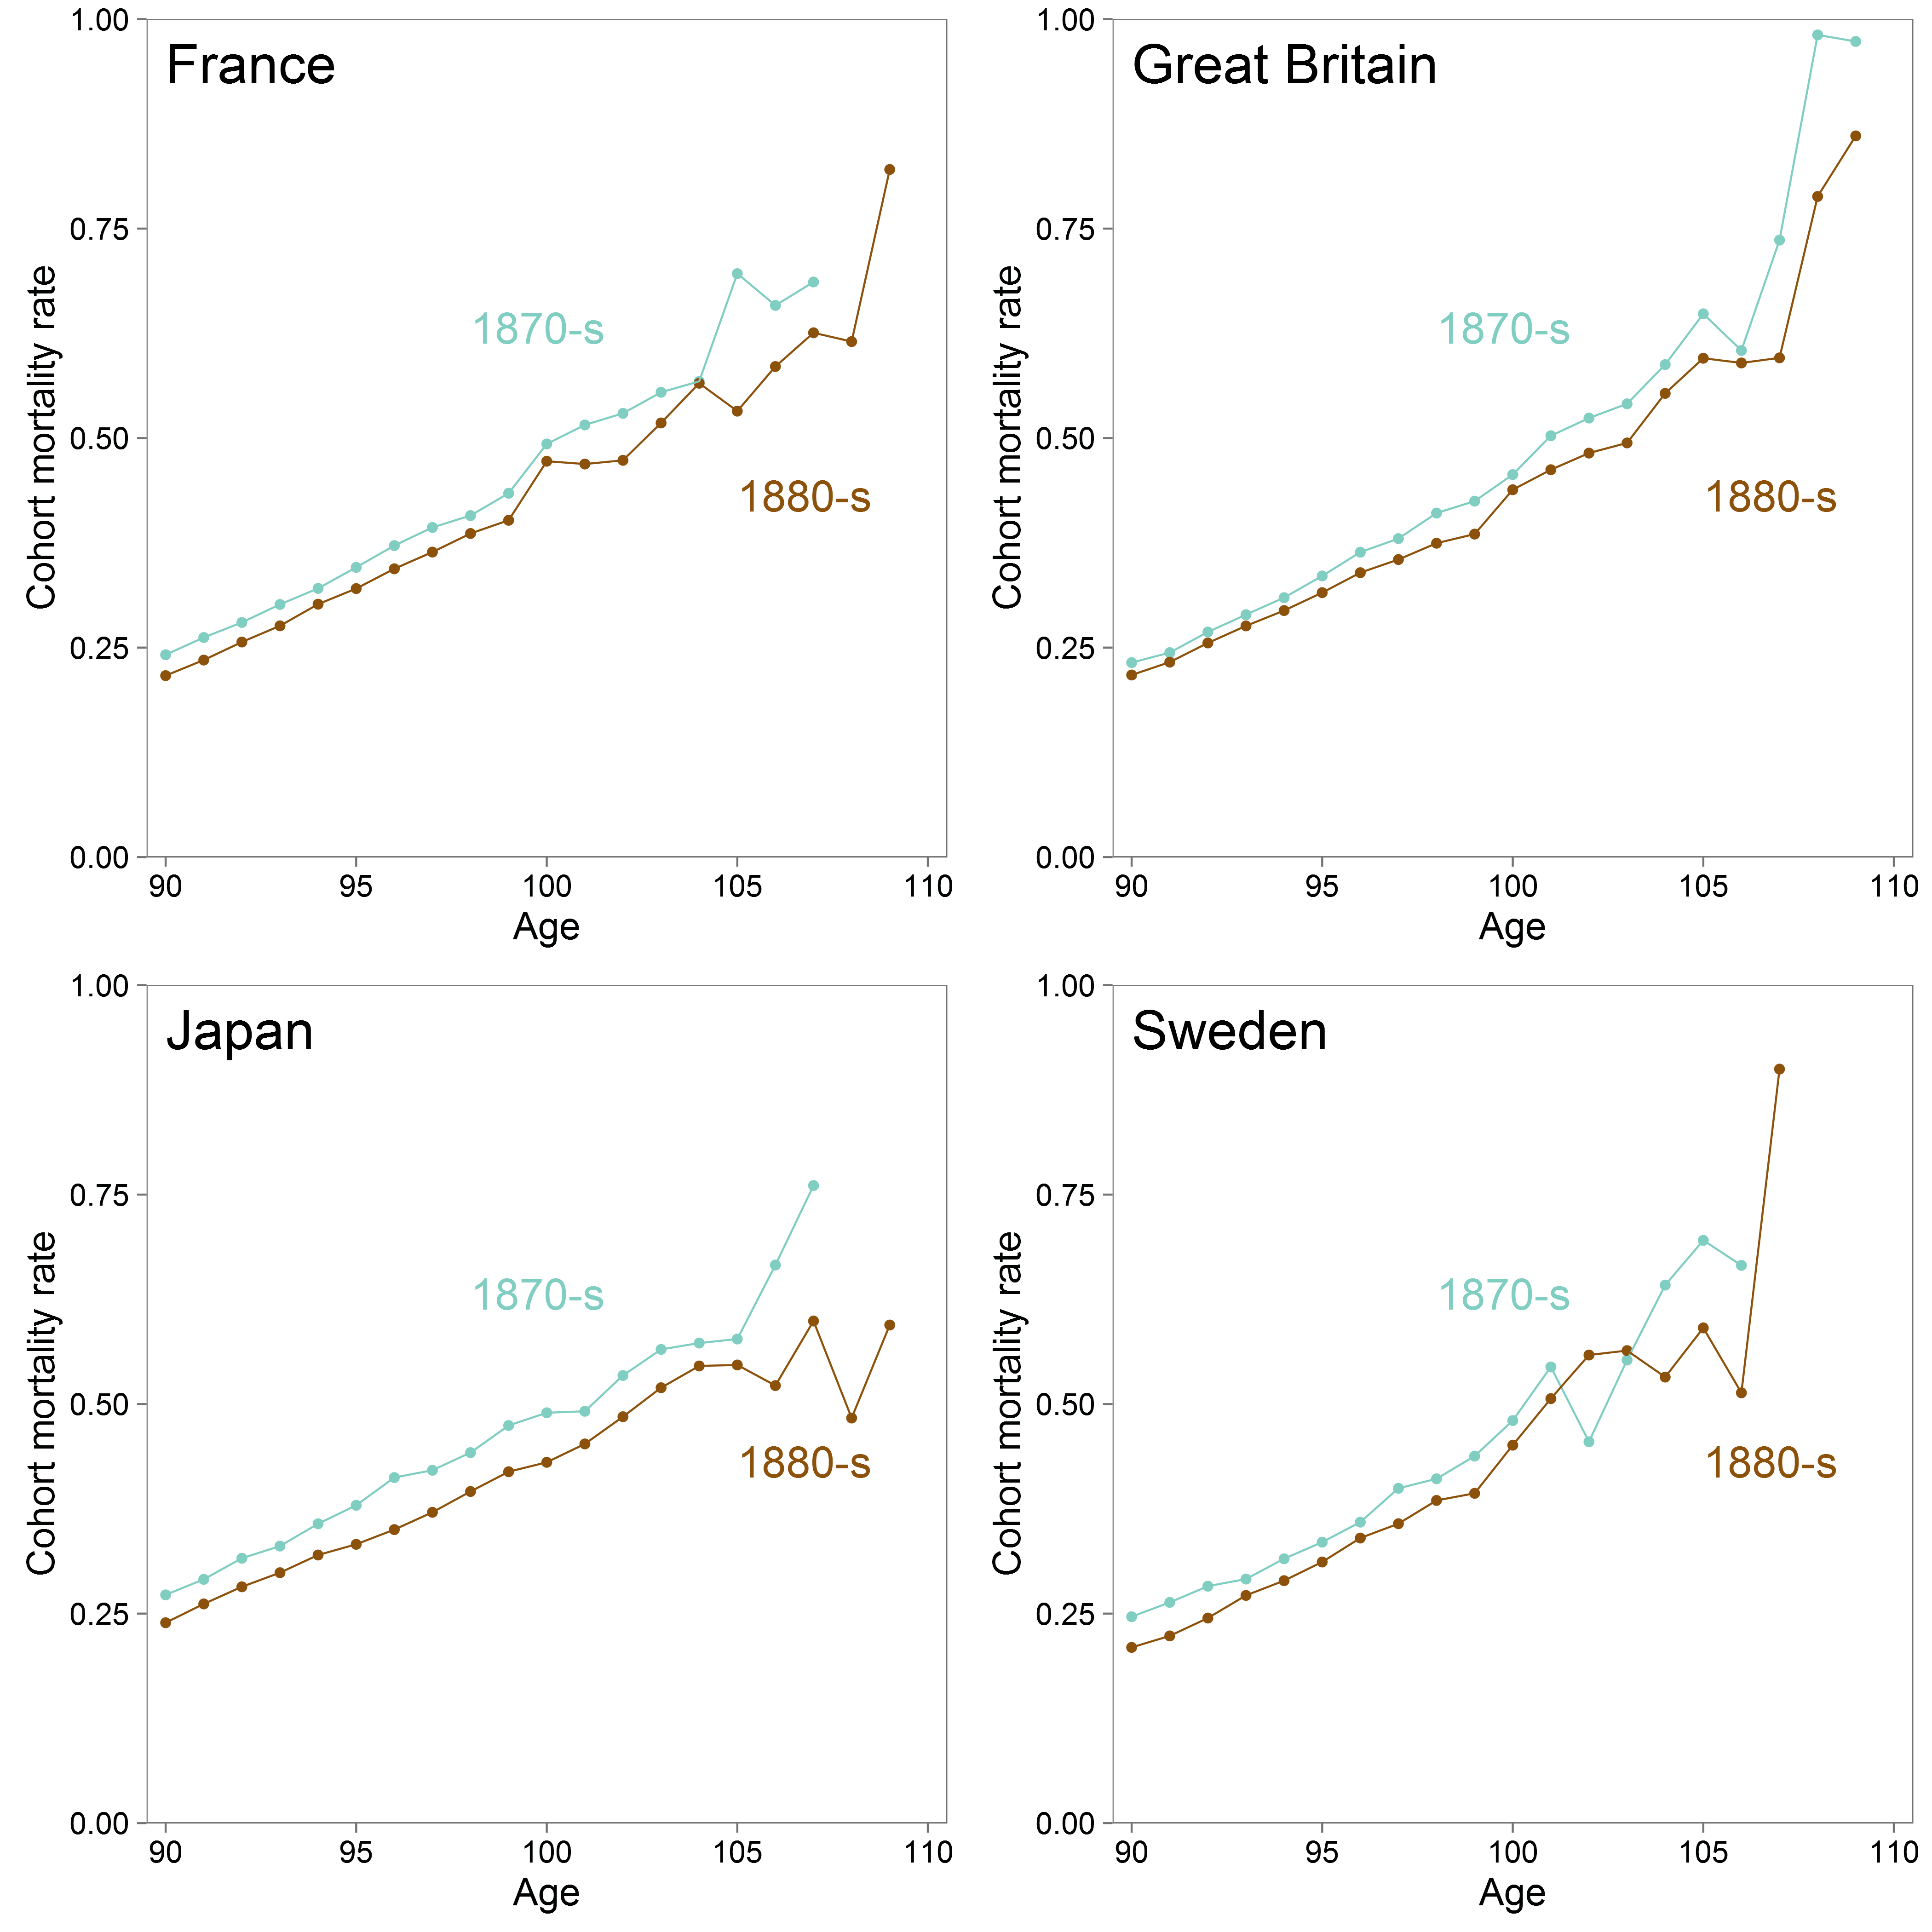
NOTE. Data are cohort age-specific mortality rates (CASMR) from Human Mortality Database (<http://www.mortality.org>). The lines represent the average CASMR over two groups of birth cohorts, ten 1-year birth cohorts each: born in 1870-s and 1880-s.
Extended Data Table 1. Yearly maximal reported age at death of supercentenarians
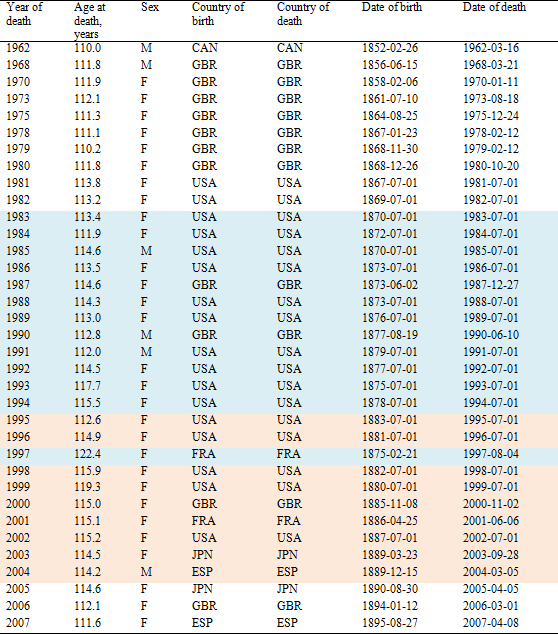
NOTE. The table provides the information on yearly maximum reported age at death (MRAD) extracted from the whole the International Database on Longevity (<http://www.supercentenarians.org>, all 15 countries included, 1968–2007, n = 668) obtained on 9 October 2016. Color background delimitates 1870-s birth cohorts from 1880-s birth cohorts.
INFORMATION ON THIS TEXT
This letter was submitted to Nature in the form of Brief Communications Arrising on 2016-10-12. It was rejected on 2016-10-26. I hope, better justified critics from scientific community will be published in Nature soon. Meanwhile, I encourage the authors to publish their comments on my letter.
REPRODUCIBILITY
The R code to reproduce the analysis and figures presented here cam be found by the link:
https://github.com/ikashnitsky/a-cohort-is-not-representative-of-humanity
Source
© 2016 the Reviewer (CC BY 4.0).
References
Xiao, D., Brandon, M., Jan, V. 2016. Evidence for a limit to human lifespan. Nature.